Project Financial Forecasts
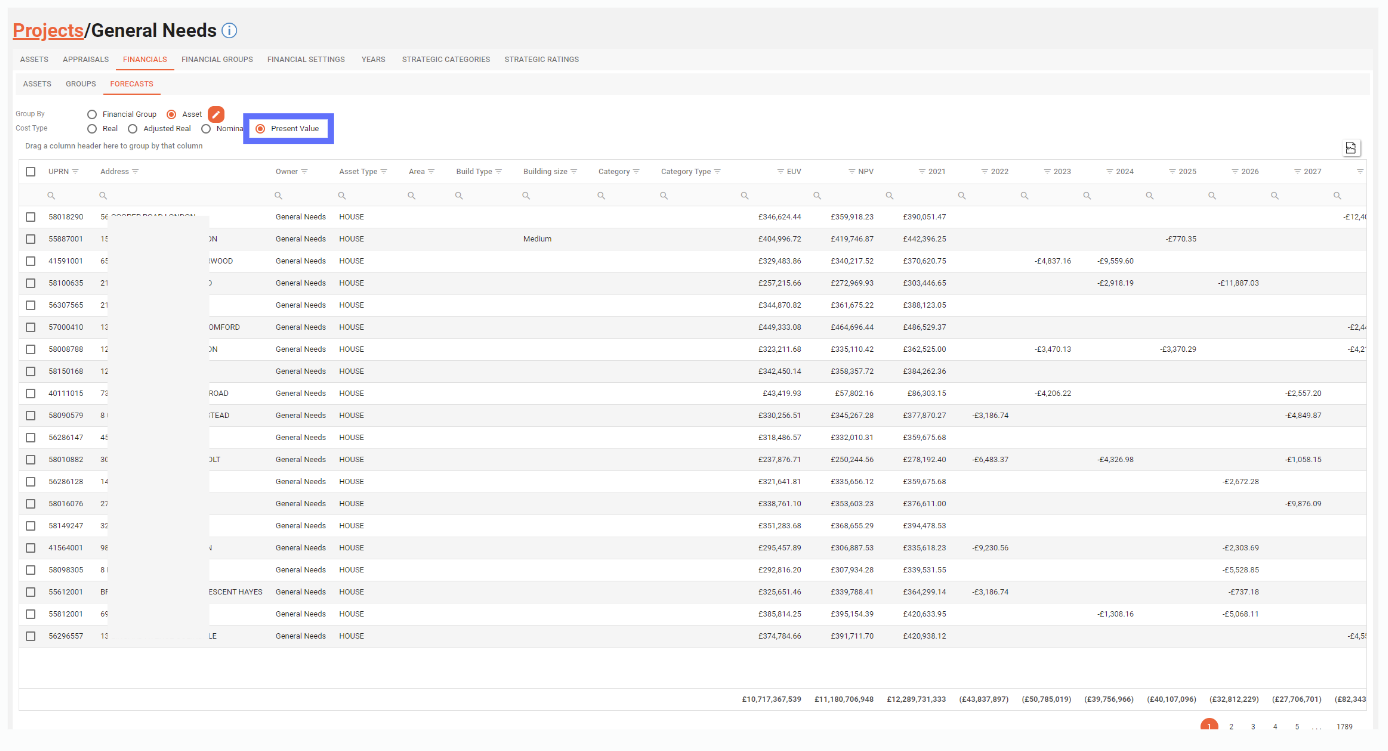
The Project Financial Forecast screen allows you to see costs per year and can be grouped in various ways to achieve the desired outcome. (see below)
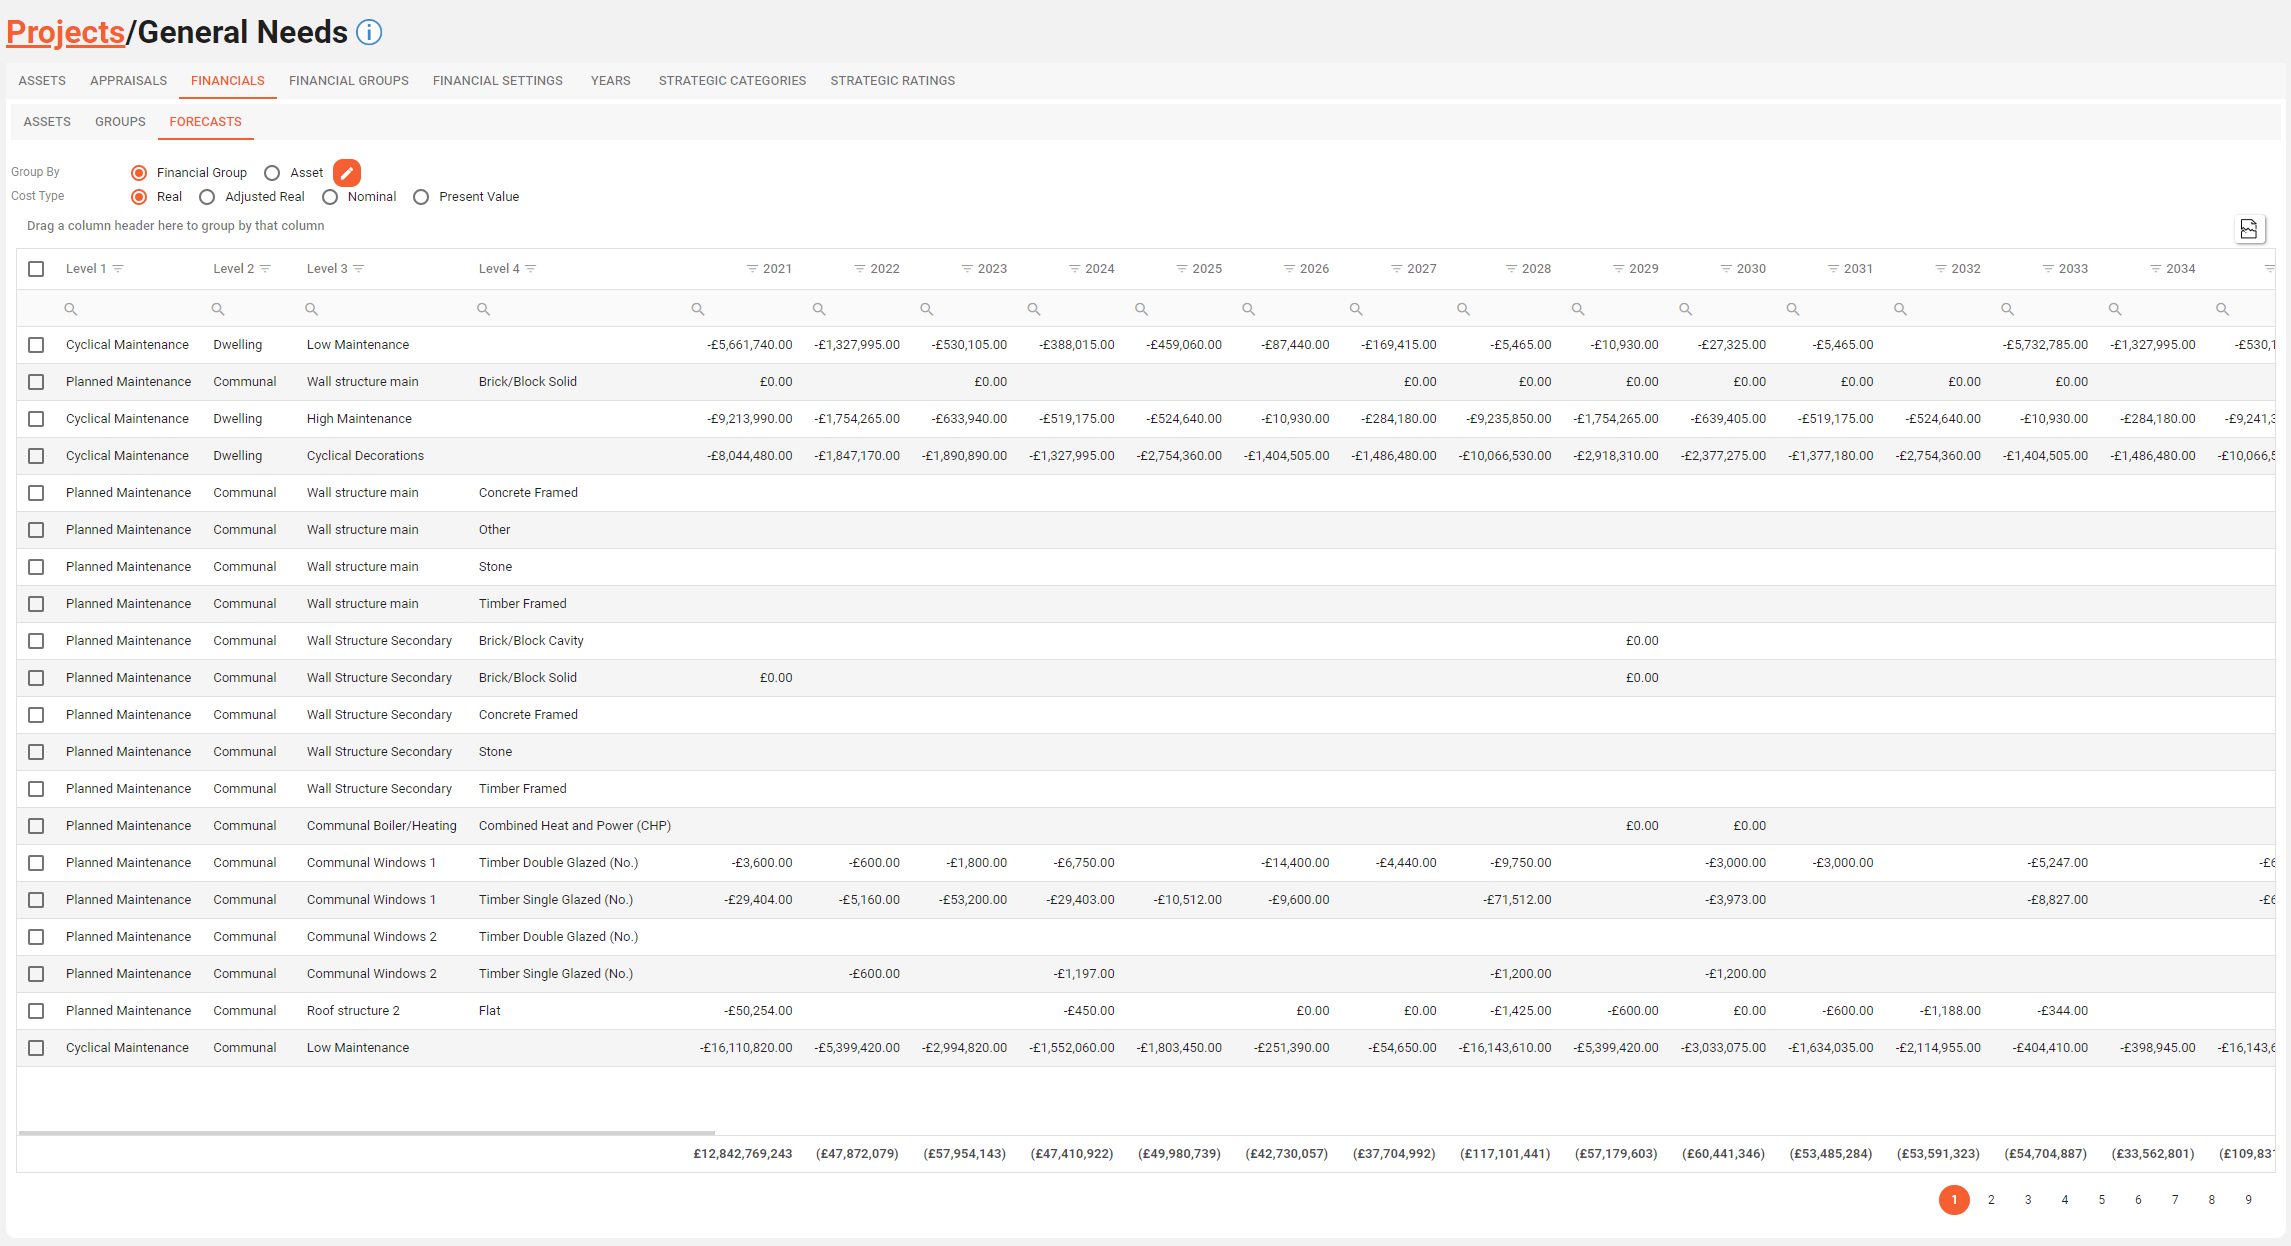
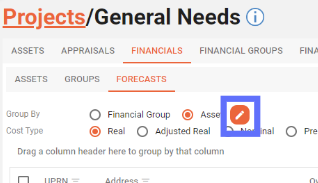
The forecast can be grouped by either Financial Group or Asset using the radio buttons at the top of the screen. (see below)
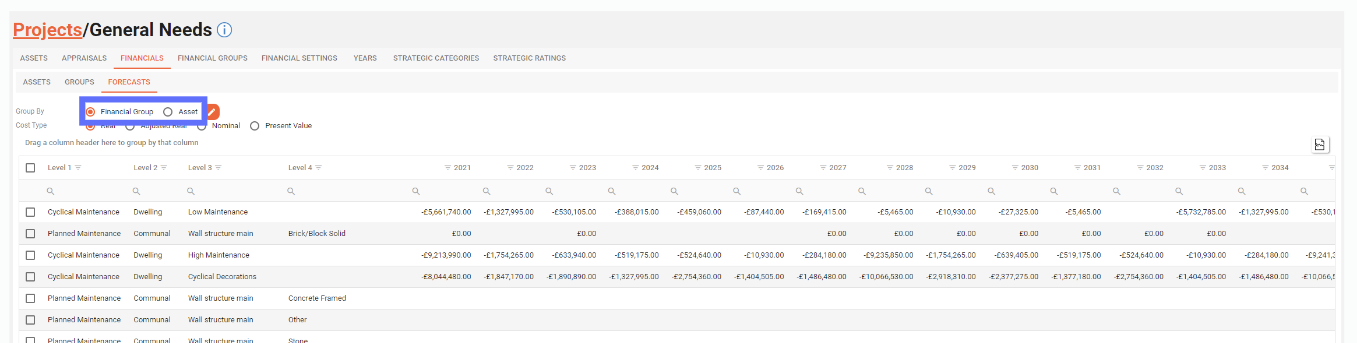
Grouping by “Financial Group” will show all of the levels of the groups set up on the Project Financial Groups screen as per the screen shot above.
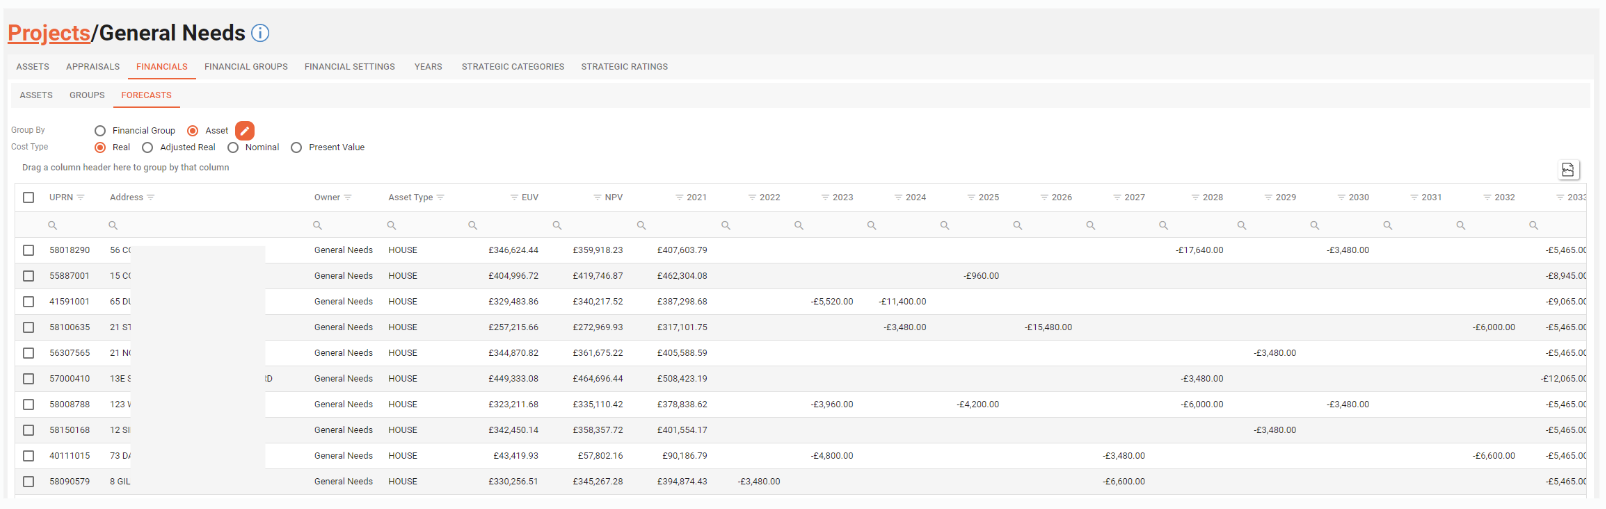
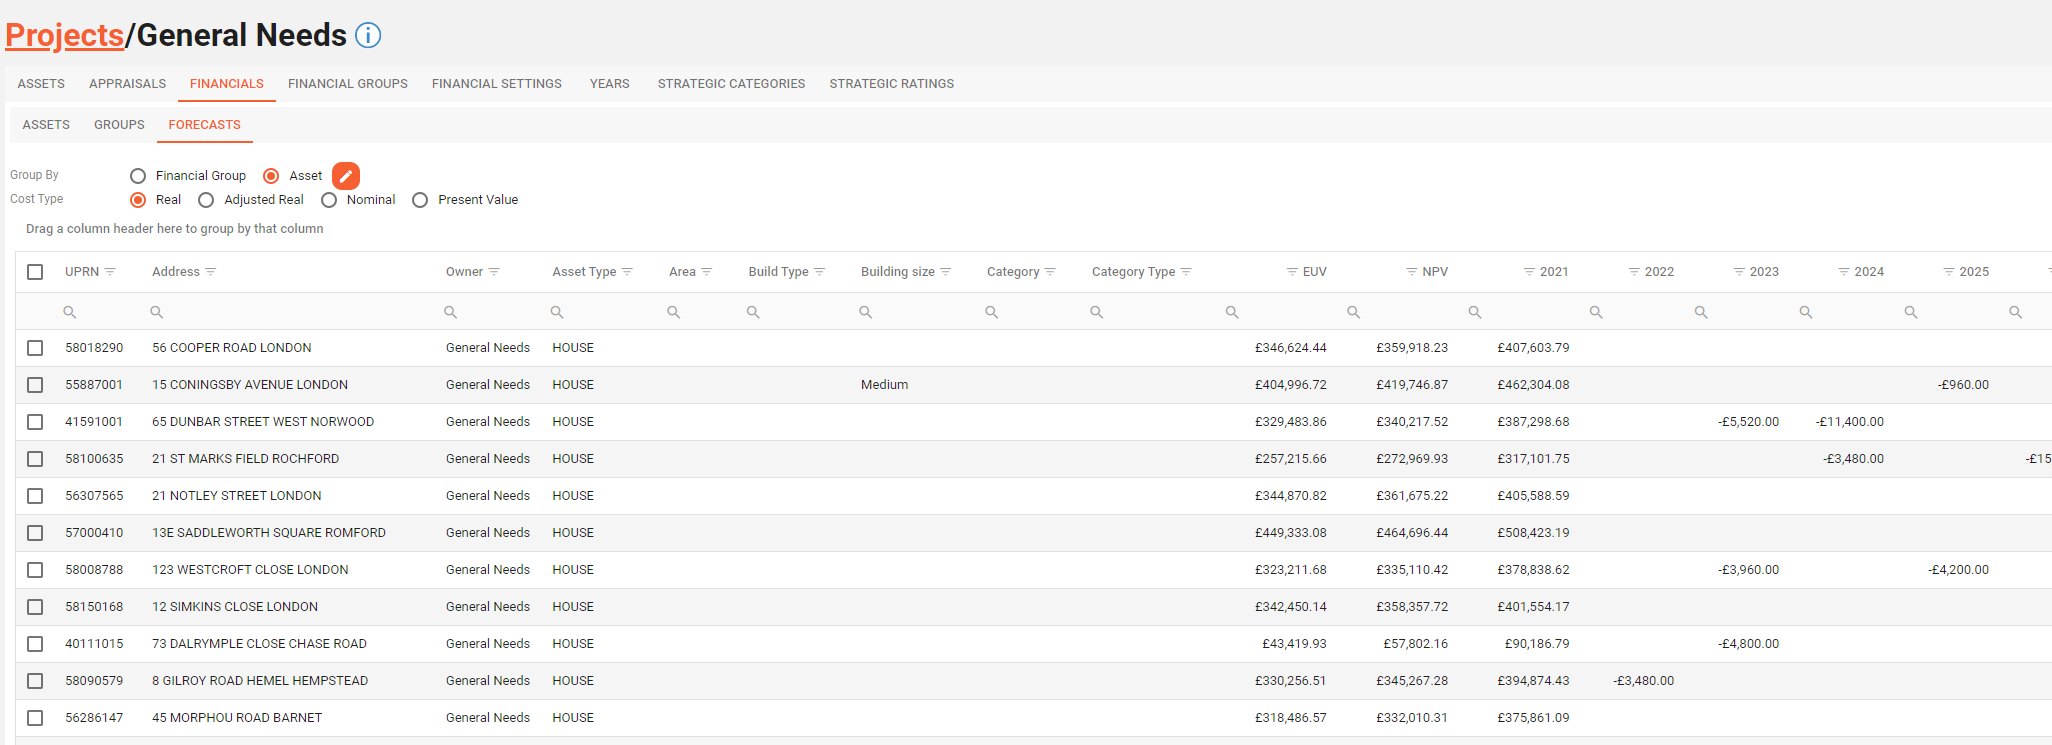
Grouping by Asset will group the costs per year for each Asset that belongs to the currently selected Project. (see below).
Additionally you can specify extra classifications to help understand the forecast by clicking on orange edit pencil icon.
This will open a popup dialogue allowing you to choose up to 5 classifications:
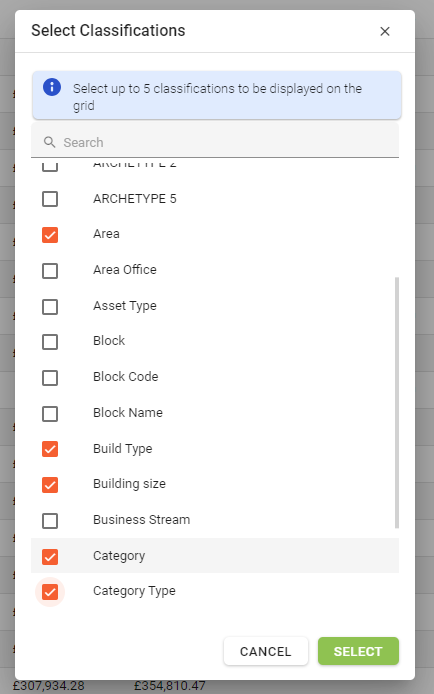
Click the “Select” button to apply the select classifications. The system will now refresh the screen and retrieve the additional information you specified.
The Cost Type can be changed for clicking on one of the following options:
Real
Adjusted Real
Nominal
Present Value
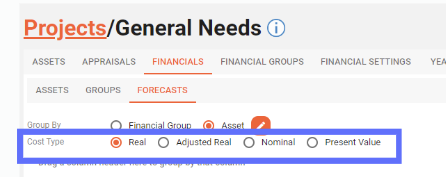
Clicking on one of the above Cost Type options will trigger the forecast to refresh it’s data and return updated figures back to screen.
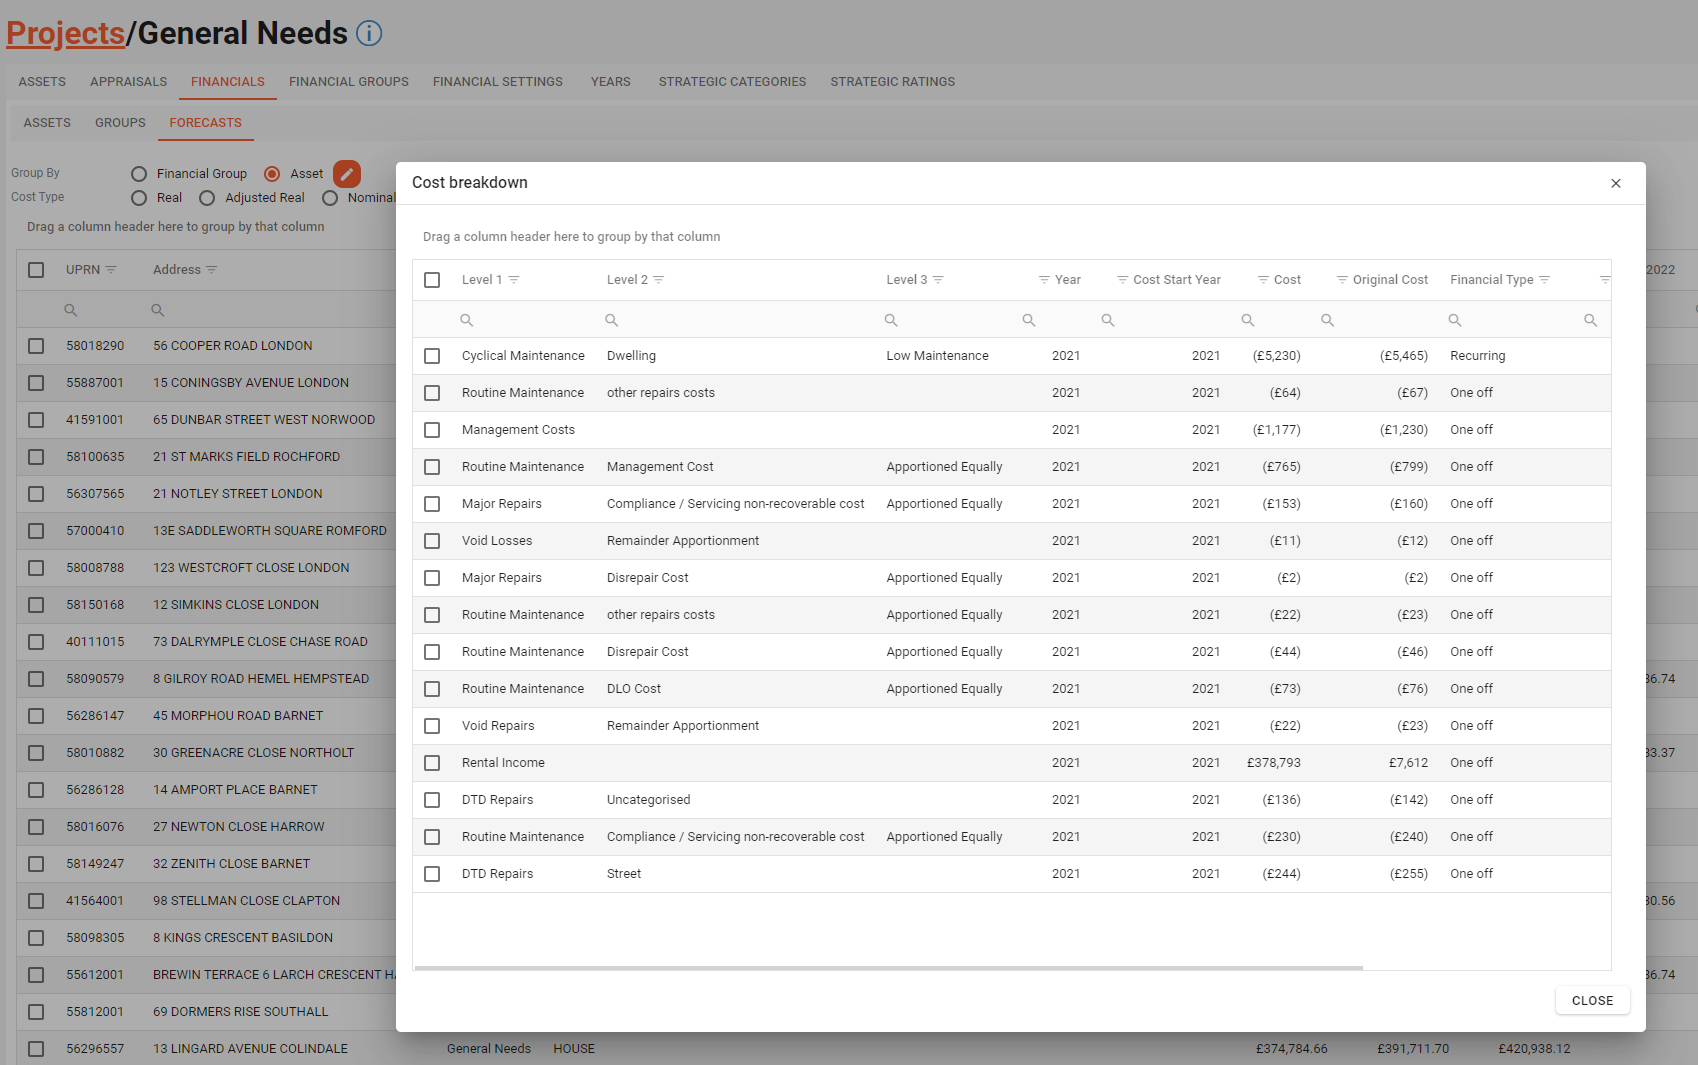
Hovering over a figure in the grid will reveal a mini popup (see below)
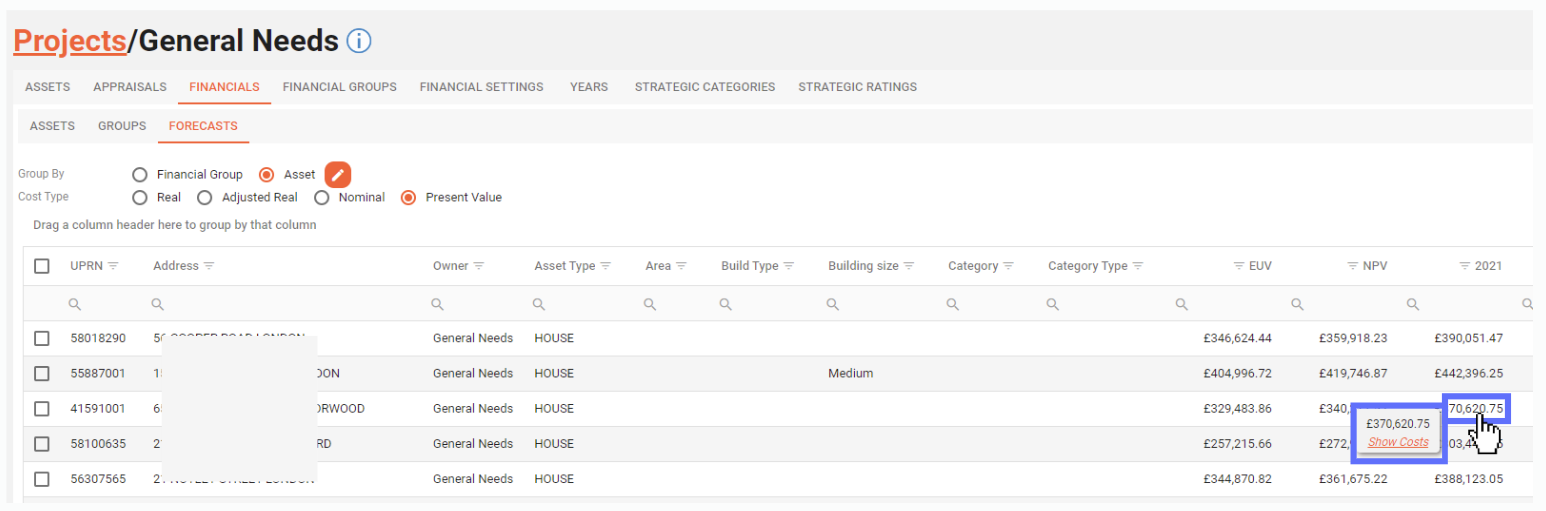
Clicking on the orange label “Show Costs” in the mini popup will reveal a much larger popup dialogue showing a breakdown of the original cost that you hovered over. (see below)