
HHSRS Survey - Likelihood
The Likelihood screen shows the average and current likelihood information for the selected hazard.
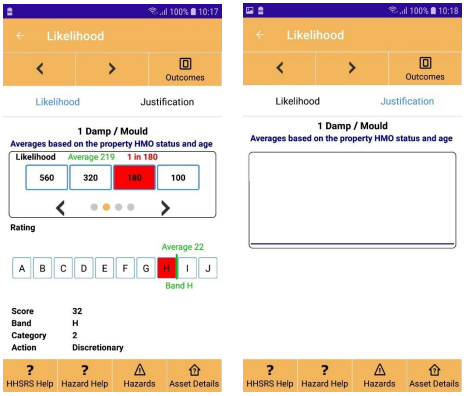
Title: This shows the selected hazard that is currently being surveyed.
Averages: This shows the factors used to determine the averages for the current hazard.
Likelihood: The average for the selected property and hazard is shown in green at the top.
The current selected value is shown in red at the top. This is initially set from the standard average data but should be changed by the surveyor to match the likelihood of the hazard for the property.
The likelihood is shown as red and can be changed by pressing the required value. As all values cannot fit on a phones portrait screen at once these can be scrolled into view with the left and right arrow buttons.
When a likelihood is selected the rating and score information will change to reflect the new value so you can always see the result of any changes.
Rating: This shows the average rating and band in green and the current rating band from A to J in red. The rating band will change to reflect the likelihood.
Score: Shows the current rating score. If the score is 1000 or above this is shown in red.
Band: Shows the current rating band. If the score is 1000 or above this is shown in red.
Category: Shows the current rating category. If the score is 1000 or above this is shown in red.
Action: Shows the current rating action. If the score is 1000 or above this is shown in red.
Justification Tab: Shows a text area to enter information for justifying the likelihood if required.
Hazard 8 Radiation: When on hazard 8 it is possible to enter a measurement if available.
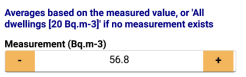
The value can be typed into the centre or the + and – buttons used. This will change the averages displayed based on the new measured value.
 | Returns to the previous screen. |
 | Shows the details of the asset being surveyed. This is available any time and is useful if you need to check any details of the asset being surveyed. |
 | Shows the general HHSRS help screen describing the basics of the HHSRS survey. |
 | Shows the hazard help screen for the selected hazard |
 | Shows the previous hazards likelihood data. If the outcomes screen has not been visited for this hazard then the rating is set to the averages for them. |
 | Shows the next hazards likelihood data. If the outcomes screen has not been visited for this hazard then the rating is set to the averages for them. |
 | Shows the Outcomes screen for the selected hazard. This allows the hazard outcomes to be set. |
 | Will return to the Hazards screen. |